
With the transition of traditional mass media tools to new media, the methodology of communication language and rules with your audience is also changing at an incremental rate.
However, what changes are not the people’s impulse, response, or reactions but the media tools. Every tool has its own languages and different using methodology which you have to know how to implement.
Traditional PR companies are generally acting to use the same ways in new media without changing anything which certainly causing them to fail. That’s not because they don’t have enough human resources, it is because they choose to ignore the changing parameters in communication language.
I might easily say that companies, politicians, or PR agencies who are the expert on audience communication are very willing to adapt themselves to the new era. However, what they understand about “adapting the new media” is, IMHO, just deciding to use new media tools at a corporate level. Although they spent precious time and money on these toys, the adaptation is not mean learning new toys but to learn about the new media platforms’ languages and communication techniques. Being alive on all new media platforms like Twitter, Facebook, etc. and having all social media accounts related to you can not be considered as an accurate adaptation of new media languages.
With this viewpoint, Today I want to talk about when the companies, brands, politicians, and even government officials have to intervene and suppress the online crises. For the politicians and government officials, we can also include particular incidents like public protest movements and activism.
When should all those intervene to contrary engagements on Twitter? How should we decide when the need for statements about the crises and public turmoil. When should the press release be released?
Now, I am striving to illuminate some rules to those questions. But I am certainly want to emphasize that all of these thoughts are based on what I have experienced in my clients’ cases past 10 years. My intention is only to bring a different approach to these incidents and trying to add a different parameter between the decision parameters.
Before talking about “when we should intervene in the crises” first we have to decide, either it is a crisis or not. Because of that, before starting to read the rest of the article, I suggest you read my previous blog post “How you should interpret the Reach/Exposure Ratio in your Campaign or Online Crises.”
We all know that a massive public protest movement or activism can shake if not take down politicians, governments, or brands and companies. Nowadays, most of the crises emerge and grow by Twitter’s lighting speed engagements. That’s why I will try to examine the character of crises or protest movements and activism on the Twitter platform first.
Here we go…
During the last decade, my team and I have examined hundreds of large and small crises. For most of the political crises, the Tweet-time graph tends to show a sinusoidal outcome. Mathematically, this analogy may be inaccurate, but because of the similarity in graphics, I’ll use it for the rest of the article by apologizing to mathematicians. Perhaps, to say “Periodic Functions Graph” or “Oscillating Function Graph” might be more accurate. Anyway…
We’ve already diagnosed (as mentioned in my previous blog post) the case as a long-term crisis. Then the behavior of the graph has to be like an oscillating graph. But which kind of “Oscillating Function Graph”?
Let’s talk about the types of graphs and look for the answers to questions separately for each type of “Oscillating Function Graph.” Keep in mind that all crises have a different characteristic of intervention.
First I want to clear the jargon used in these graphs which I’ll use them much in this piece.
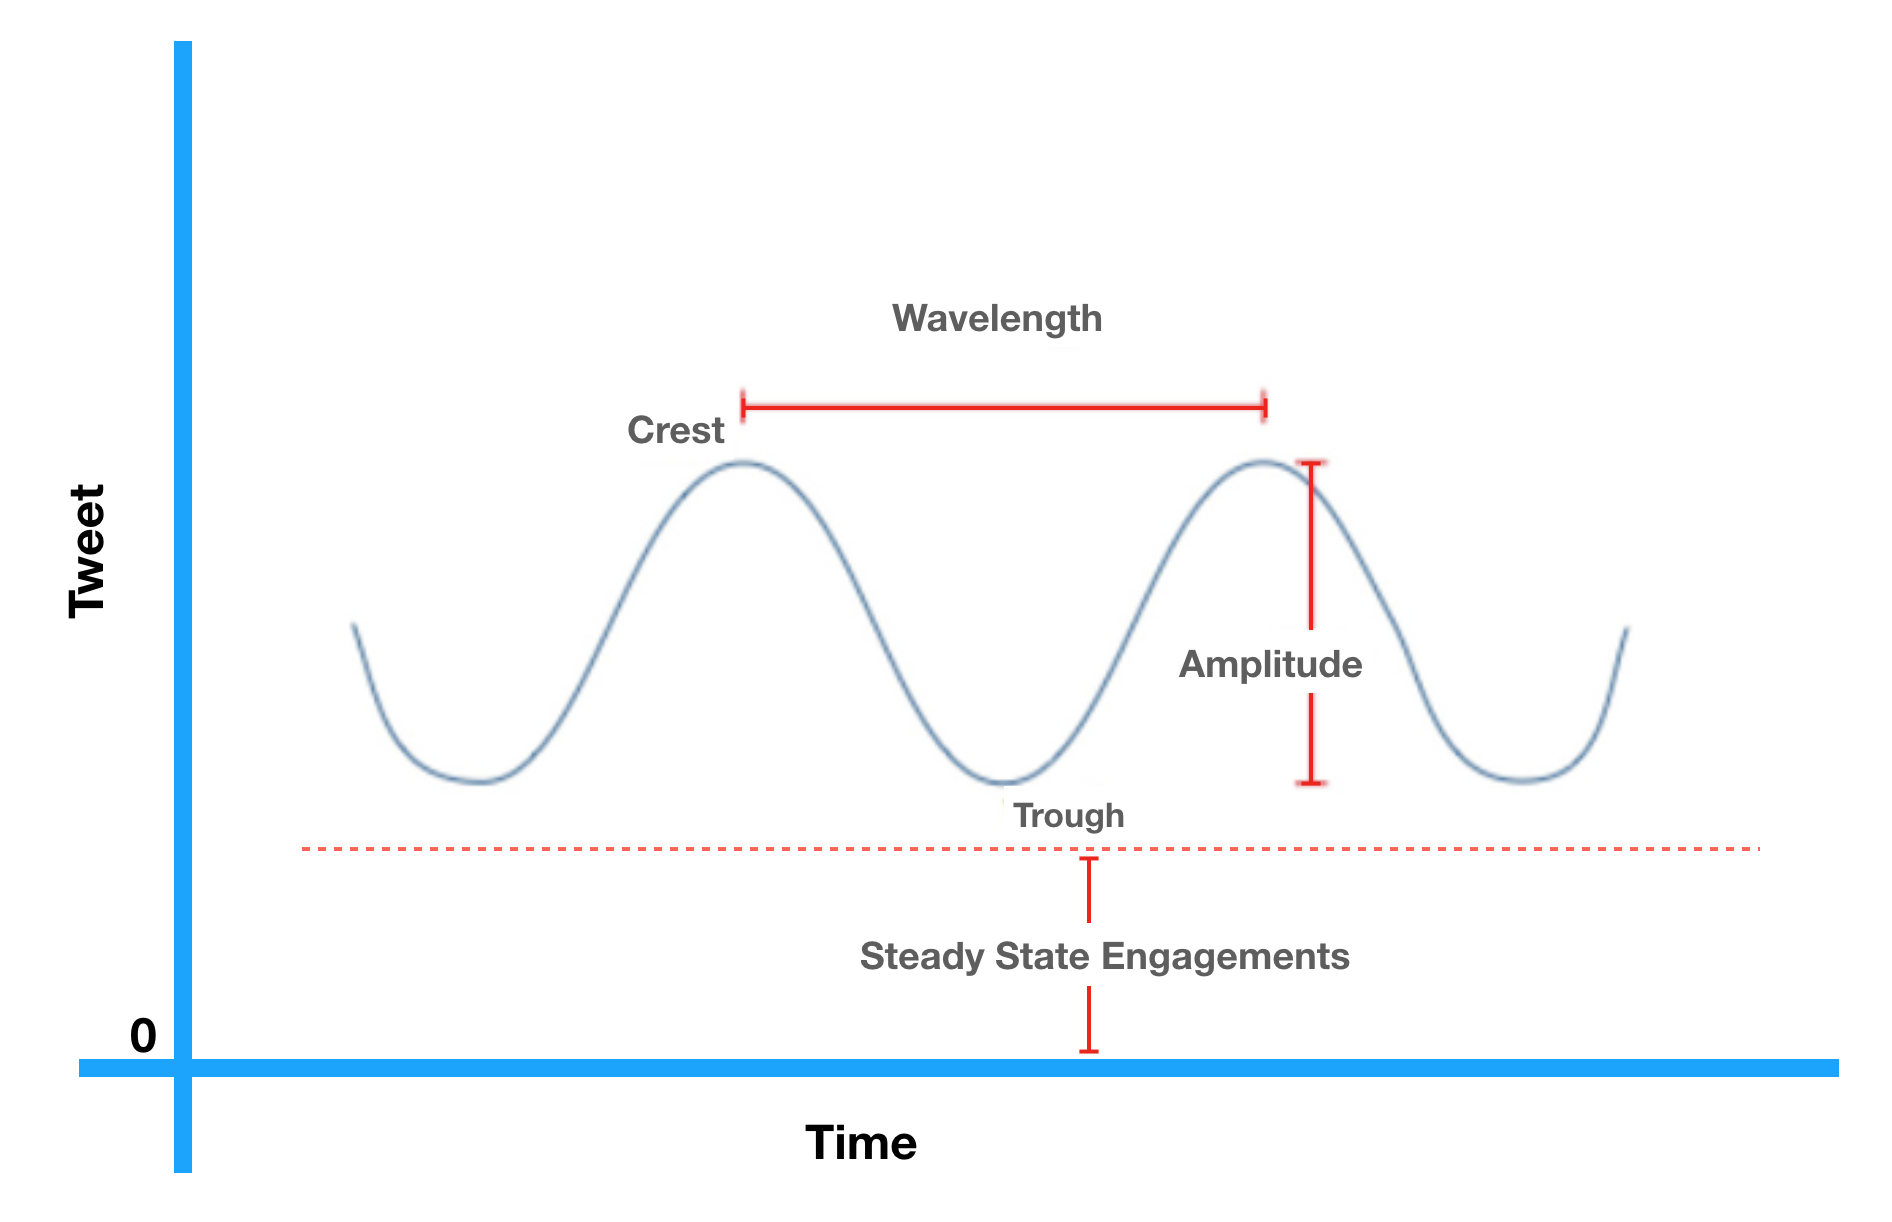
- The Amplitude
It shows the engagements or exposure of every wavelength for a definite time interval on the Y-axis. As I mentioned above, we are focusing on long-term crises like those likely to take more than two days to end.
- The wavelength: The period of the graph, should larger than 12 hours to be meaningful.
- Cres: the moment of the top engagements
- Trough: It is the dip of duty.
- Steady State Engagements: The point where the oscillation ends. This level has a special meaning behind all we are mentioning.
Kinds Of Graphics’ Behavior – Crises / Public protest movements and activism protest movements / Politic Issues
All the graphs are Tweet / time-depended graphics.
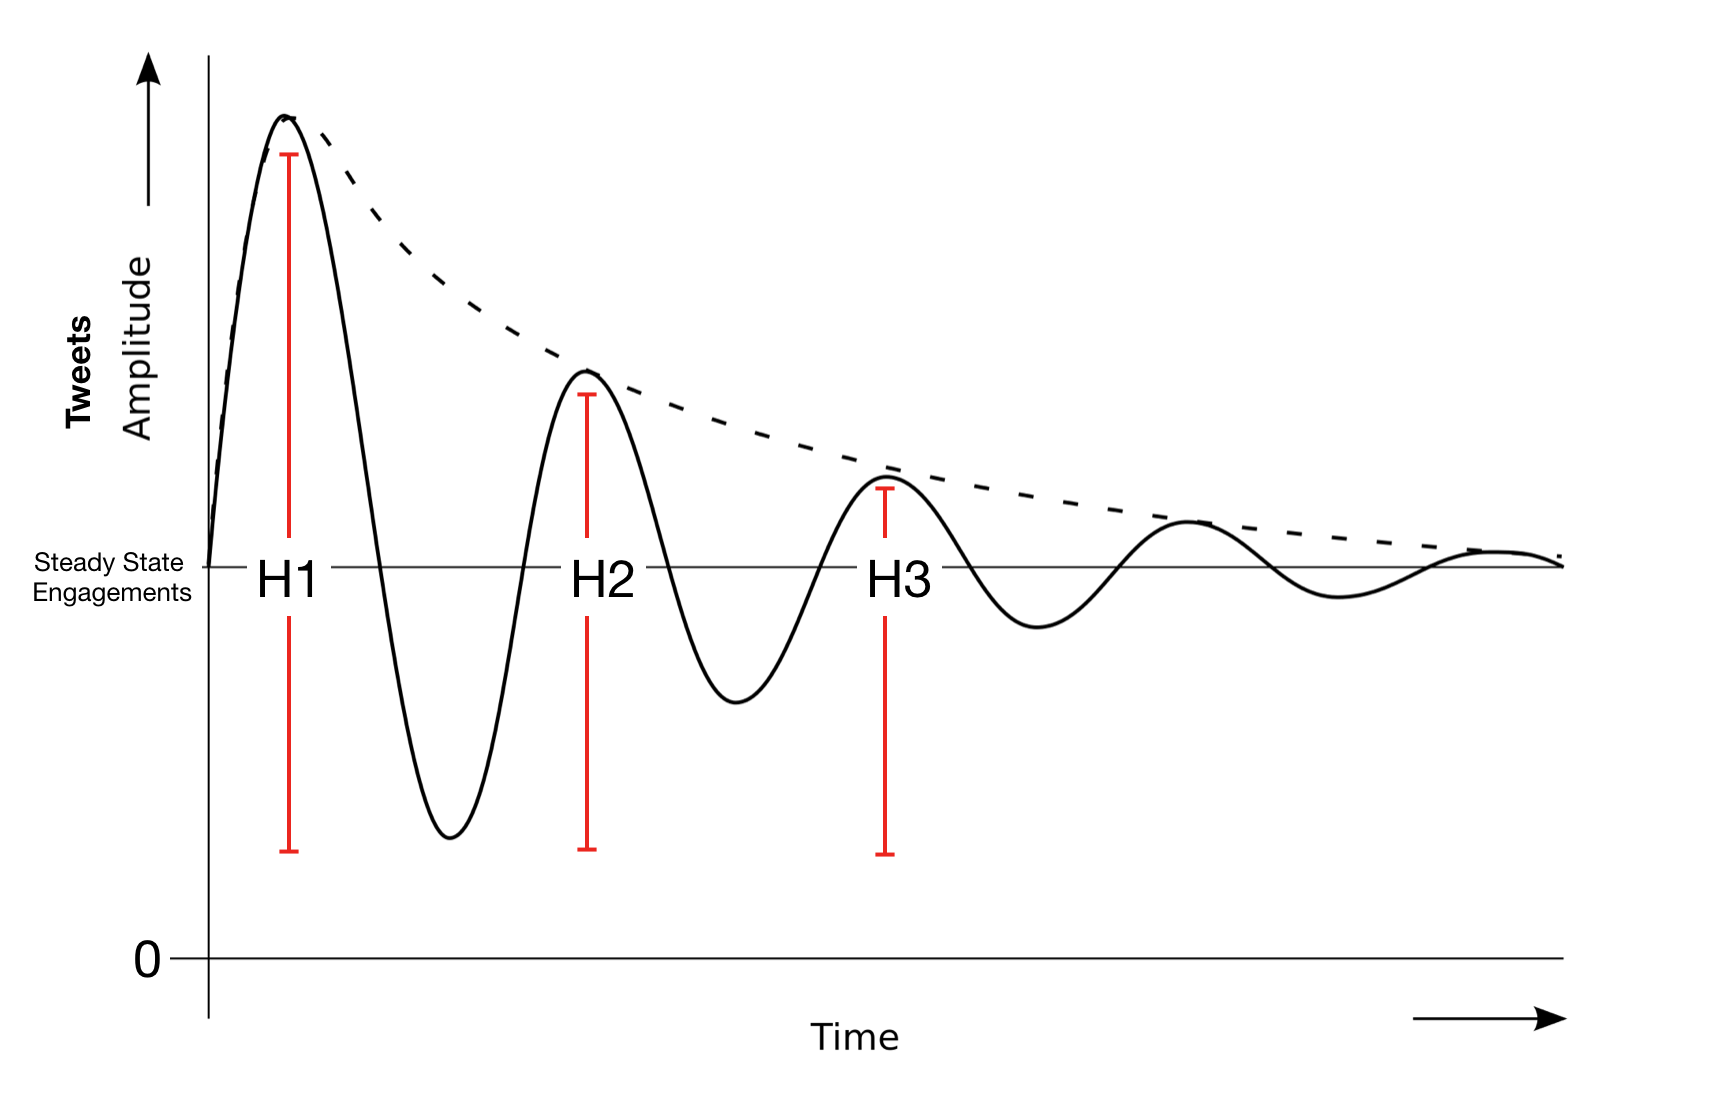
As you see on the above graph, H1, H2, H3 indicates the amplitude of engagements. The changes in amplitude in every wave has a different meaning. First, we will focus on decreasing amplitudes.
It is necessary to emphasize again that focusing on the pattern brings you the result, not on the numbers or ratios. To give specifics on particularly in multivariate equations is impossible, but every case has a unique characteristic. Please consider the numbers I write as an only statistical pattern I learned from public incidents, protest movements and activism, and public crises my team and I engaged past 10 years.
For wavelength has been adjusted at least 12 h time interval and;
-
If the H2 < 0.7 H1;
This type of crises will ease off eventually. For most of the crises, whether the crisis will end or going continue with a higher amplitude could be understood by the parties after the first 12 hours passed. Usually, the affected party tries to intervene in the crisis as soon as they realize something is happening without waiting for the minimum time interval (min. wavelength). If you wait for at least 12hours, you’ll have enough data to analyze the incidents, and will easily decide if it is an emergency or not. If you see such an outcome (H2 < 0.7 H1), then you can be disinclined to intervene in the crisis, and you can stay low profile without making an official statement at this time.
-
If the oscillation percentage is fluctuating between H1, H2, H3… H(n) and around +-%10;
In these cases, you should normally wait until 4th wave to come out. If the amplitude of the 4th wave still big enough and not decreased more than %30, this means the crises/incident will not ease off itself. You need to step into the game, discuss your tactics on how to intervene with the crises, or how to make an official statement to cut off the 5th wave before happening.
-
If the H2 > 1.3 H1;
If H2 is %30 bigger then H1, this is a pre-alarm for you. It means the crises or incident will have a considerable impact if not intervened. There might be lots of influencers involving Twitter’s engagement. The influencers could cause sharp increases in the graph, and this attracts and onboard people at an exponential rate.
-
If the steady-state level not close to zero at the end of all crises
Generally, the steady-state level has to be very close to zero points. But in some particular cases, it will not. This behavior occurs typically when no one interferes with the critical crises. Let’s say; It happens when the Politicians or government officials frequently ignore the public movements while there was a strong expectation for official statements regarding the crisis.
If the steady-state level not close to zero at the end of all crises, and politicians or government officials have not published an official statement, then the crisis will repeat with similar oscillations in the near future. They are most likely on the verge of new crises. So, the politicians or government officials should make their official statement at this point, or the crisis will repeat itself most probably with a higher intensity.
Impacts of the influencers cause the crests on graphs, and there is a significant correlation between the length of amplitudes and the number of influencers involved with the crises or the incidents.
Taking everything into consideration, we can easily say that the graphs give us cues or meaningful data about the crises and help us to determine the approximate time to intervene with crises.
You can implement this methodology we talked through with this article to your own audience, society, and community during a crisis. You have to regularly watch and follow the reactions of people, engagements, and patterns on the graphs. After that, you can create a statistical model of your community.
Finally, don’t miss that another critical thing is to know “How to intervene or suppress the crises.” I experienced lots of crisis went south because of the wrong crises managements or false political statements and ended up as disasters. To know how to intervene with the crisis is another experience area that the brands, politicians, and government officials should have acquired before something terrible happens, and they have to employ a team of experts with experienced consultants.
I wish a life without a crisis for all 🙂